Frequency-Guided Network for Low-contrast Staining-free Dental Plaque Segmentation
Yiming Jiang1,
Wenfeng Song*2,
Shuai Li*1,3,
Yuming Yang1,
Bin Xia4,
Aimin Hao1,
Hong Qin5
1Beihang University,2Beijing Information Science and Technology University,3Zhongguancun Laboratory,4Peking University School and Hospital of Stomatology,5Stony Brook University
Traditional dental plaque detection relies on medical staining reagents and professional intervention. Deep learning-based automatic staining-free dental plaque segmentation provides an alternative for patients to perform plaque detection at home without staining reagents. However, existing methods still struggle with low-contrast visual features between unstained plaque and healthy teeth.
To address this, we propose a Frequency-Guided Network (FGN) for low-contrast staining-free dental plaque segmentation.
We observe that dental plaque tends to concentrate specifically near the junction between the teeth and the gingiva. This junction demonstrates abrupt changes in pixel values, indicating high-frequency regions in the image. In other words, dental plaque tends to appear near the high-frequency regions of oral endoscope images. Exploiting this characteristic, we employ a frequency-guided decoupling module to separate the image into high-frequency and low-frequency regions automatically and expand the high-frequency region to encompass nearby potential dental plaque. Then we supervise two regions individually to specifically focus on the expended high-frequency region for localizing nearby dental plaque.
Additionally, we propose a high-to-low frequency multiple tasks framework. In the first phase, the network segments the teeth region, and then we input the teeth mask into the second phase. In the second stage, the teeth mask allows us to have a higher frequency at the junction between the teeth and gums, thereby enhancing the effectiveness of frequency-guided decoupling. Furthermore, FGN integrates a frequency-driven refinement module to enhance the guidance quality of the teeth mask for the second phase.
Extensive evaluations of the oral endoscope dataset demonstrate that our method outperforms existing high-performance segmentation methods. User studies also confirm that our approach achieves superior results to experienced dentists.
Method
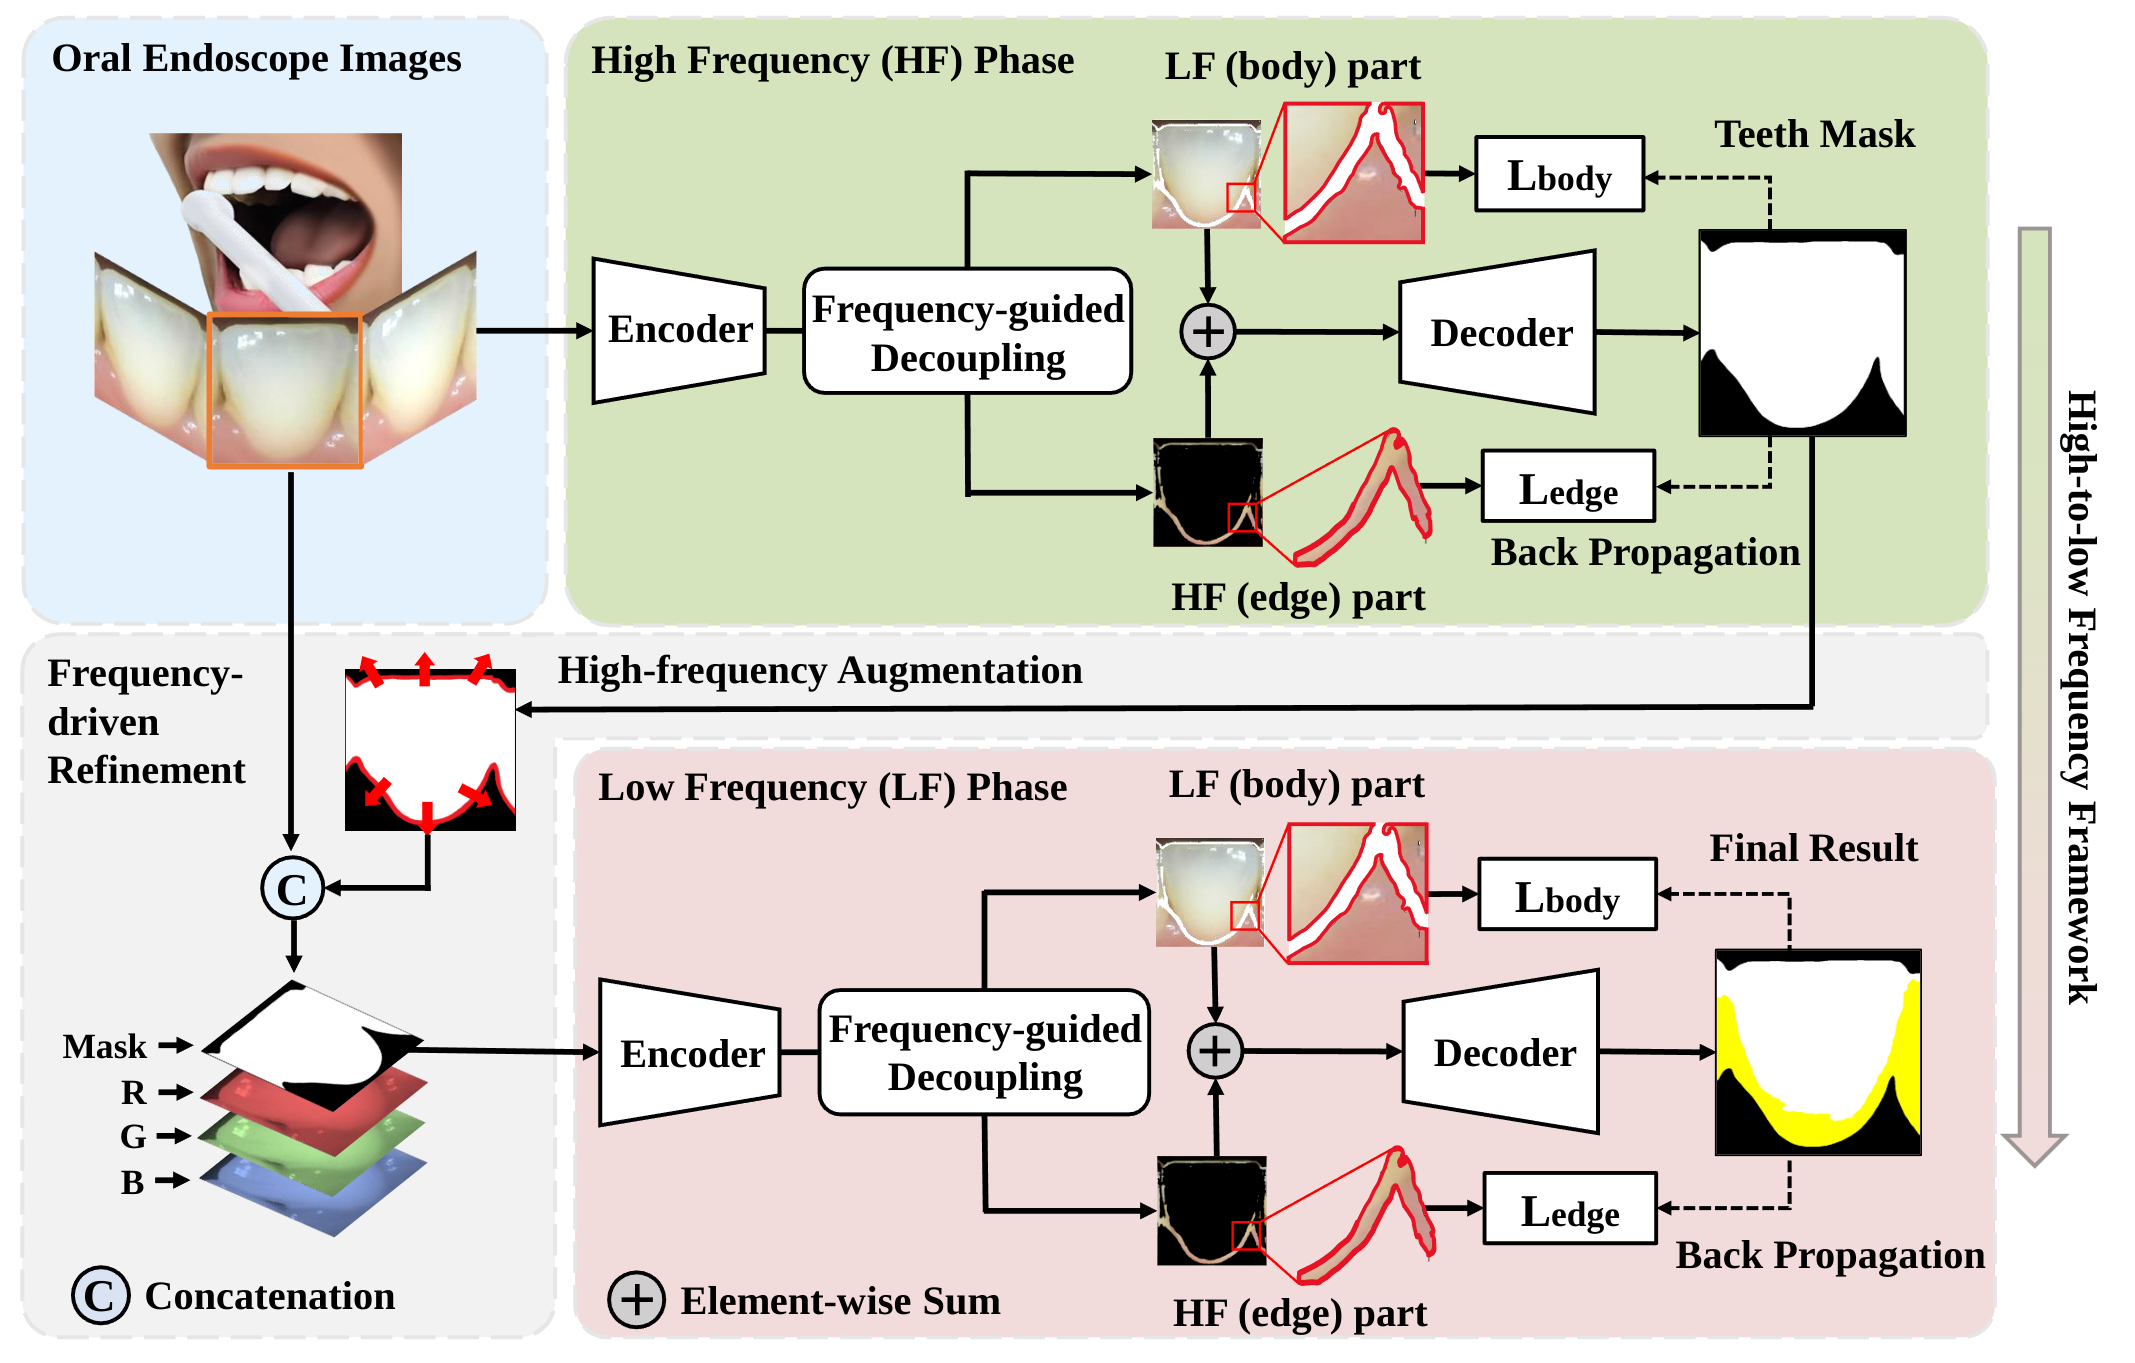
The illustration of our framework. In the HF phase (green box), we segment
teeth and non-teeth regions using our frequency-guided network.
Specifically, we supervise the high-frequency edge and low-frequency body parts of the teeth,
respectively.
In the frequency-driven refinement module (grey box), the HF phase result is refined using
high-frequency augmentation and combined with the raw image.
In the LF phase (pink box), we use our frequency-guided network to segment the plaque and
non-plaque regions, producing the final segmentation result.
Of which, ``$\textcircled{c}$" denotes concatenation and ``$\oplus$" denotes element-wise
addition.
More Experiment and Evaluation Details
We gives more details as complementary to the
paper’s Experiment and Evaluation parts.
Parameter analysis
We analyze the critical parameters of high-frequency augmentation and the attention
mechanism positions.
The high-frequency augmentation parameters. The high-frequency
augmentation
parameters affect the LF phase's input, influencing our methods' performance. The two
main
parameters are S_d and S_o. To investigate the impact of these parameters, we perform
high-frequency augmentation with three
different sets of parameter values on the teeth mask. This results in three datasets,
namely
ENHAN-1, ENHAN-2, and ENHAN-3. Then, we evaluate our methods on each dataset as the
input of
the LF phase to
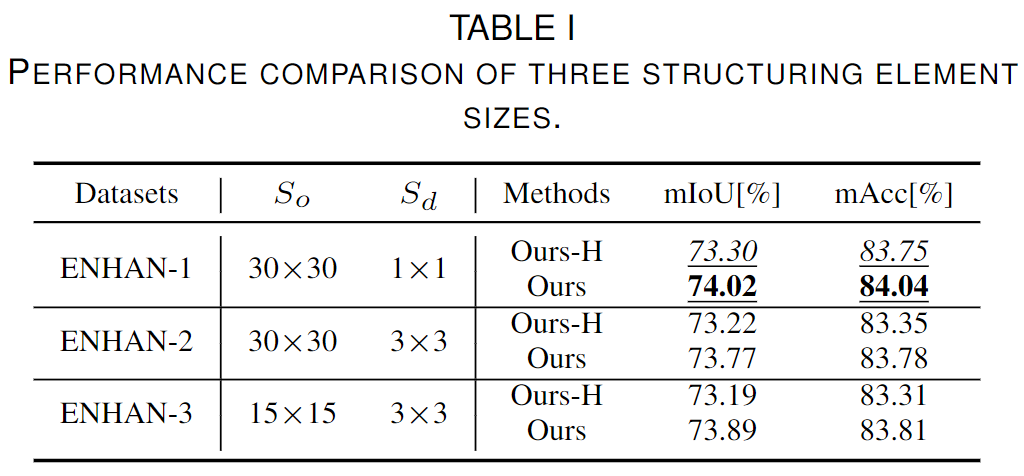
assess the mIoU and mAcc. The result are shown in Table I. We observe
that
the ENHAN-1 dataset performs slightly better than the other two. As a result, we
empirically
select the parameter values from ENHAN-1 for our methods.
The attention modules positions. Furthermore, we investigate the impact
of
adding the attention modules at different positions in our method. We add the channel
and spatial attention modules after certain positions in parallel. Specifically, we
consider four different positions for adding the attention modules: no attention module,
after the ASPP module, after the edge part of the
decoupling module, and after the last feature map before the final upsampling. The
effect of the
attention modules varies for the two variants of our method.
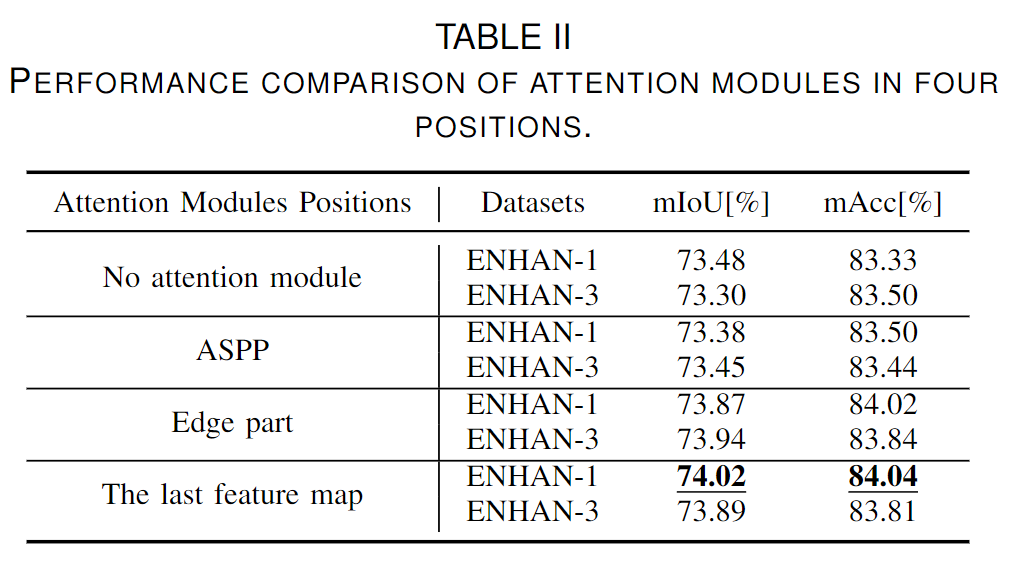
Table II shows the results obtained for the four different positions on
datasets ENHAN-1 and ENHAN-3. The results are similar for each position on both
datasets, but the gaps between different positions are significant. Adding the attention
modules after the last feature map results in the best performance, increasing 0.54% in
mIoU and 0.69% in mAcc.
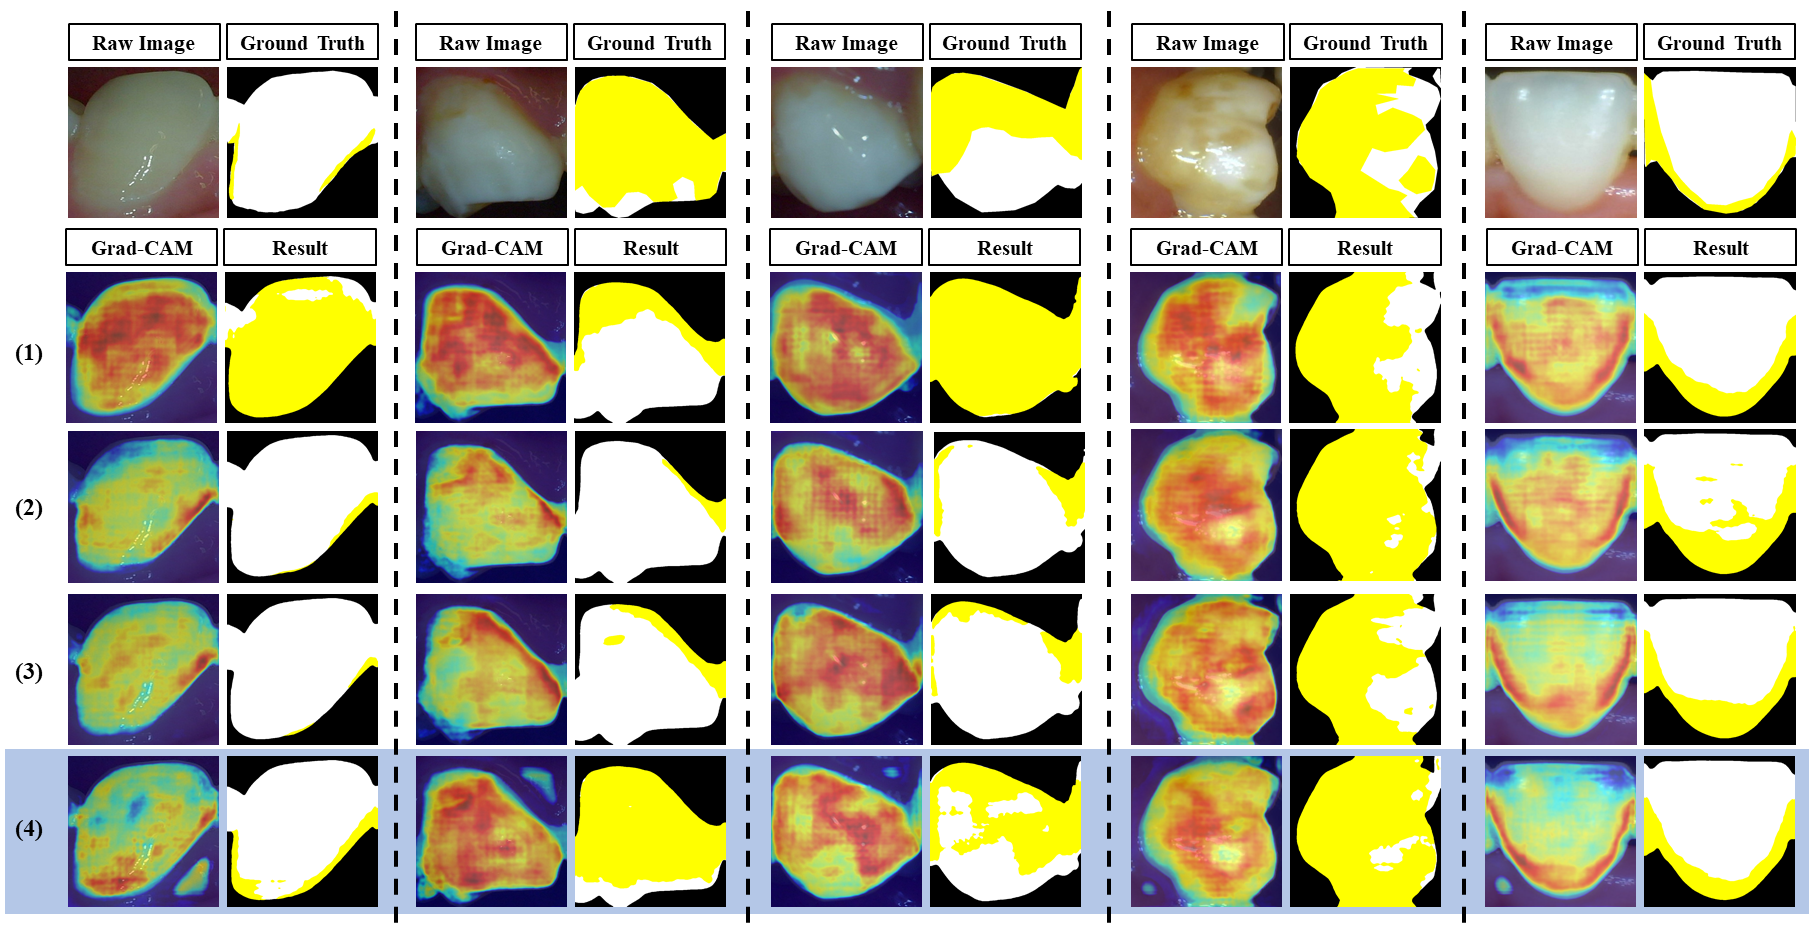
Fig.1. Qualitative comparisons with four
attention
modules
positions. In the top row, we demonstrate the raw image and ground
truth for
reference. We conduct experiments with four different positions for adding
the attention modules. In the second to fifth rows, we show the results and
Gradient-weighted Class Activation Mappings of the final layer. Although
some CAM diagrams exhibit the checkerboard
pattern due to grad-CAM's limitations, it does not affect the maps'
interpretation. The
four positions for the attention modules are as follows: (1) no attention
module,
(2) attention modules added after the ASPP module, (3) attention modules
added after the edge part of the decoupling module, and (4) attention
modules added after
the last feature map and before the final upsampling.
Fig.1 provides visualization results of the final layer's
Gradient-weighted Class Activation Mappings (CAM). Notably, adding the attention modules
after the
last feature map allows the network to focus more on the areas of the teeth not covered
by plaque.
Although some CAM diagrams exhibit the checkerboard pattern due to grad-CAM's
limitations,
it does not affect the maps' interpretation.
Visual analysis and visualization results
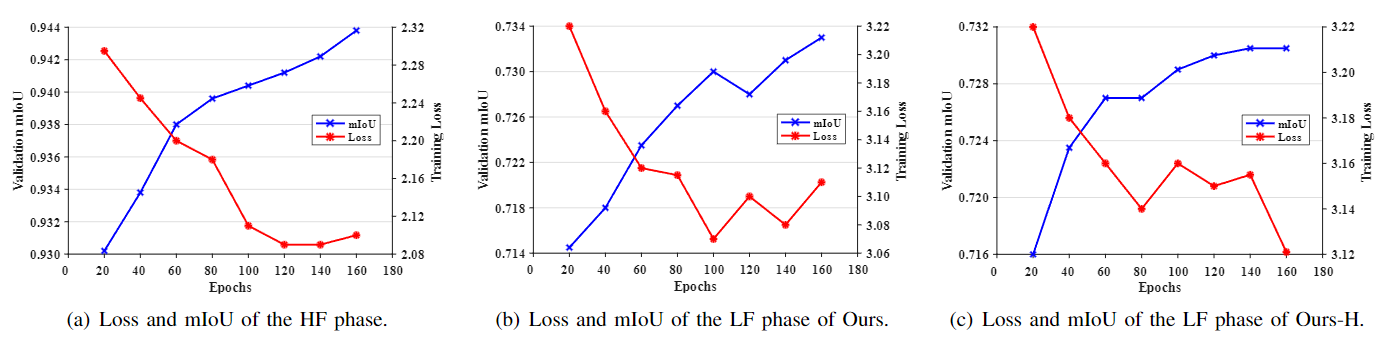
Fig.2. Training loss and validation mIoU of the HF and LF phases in
training.
(a)
Shows loss and mIoU of the HF phase, (b) shows loss and mIoU of the LF phase
of
Ours, and (c) shows loss and mIoU of the LF phase of Ours-H.
Visualization results of the training process metrics. In every
training
phase, the training loss drops, and the validation mIoU rises with increased epochs. The
training loss and validation mIoU of the HF phase are shown in Fig.2(a).
The training loss and validation mIoU of the LF phase of our methods are shown in
Fig.2(b) and Fig.2(c). In three figures, the blue line
shows mIoU, and the red line shows training loss. The left horizontal axis represents
validation mIoU, the right horizontal axis represents training loss, and the vertical
axis
denotes epochs. The loss curve is smoothed using a smoothing rate of 0.99, while the
mIoU
curve is smoothed with a smoothing rate of 0.9. From these figures, it can be observed
that
the training loss drops, and the validation mIoU rises with the increase in epochs from
20
to 160. Although the curve of training loss shows large fluctuations after 100 epochs,
it is
important to note that the loss curve actually drops significantly more from 0 to 20
epochs
when compared to the fluctuations seen after 100 epochs. In summary, the curves in all
three
figures start to fluctuate after 100 epochs, indicating that the model has been trained
to
its optimal performance.
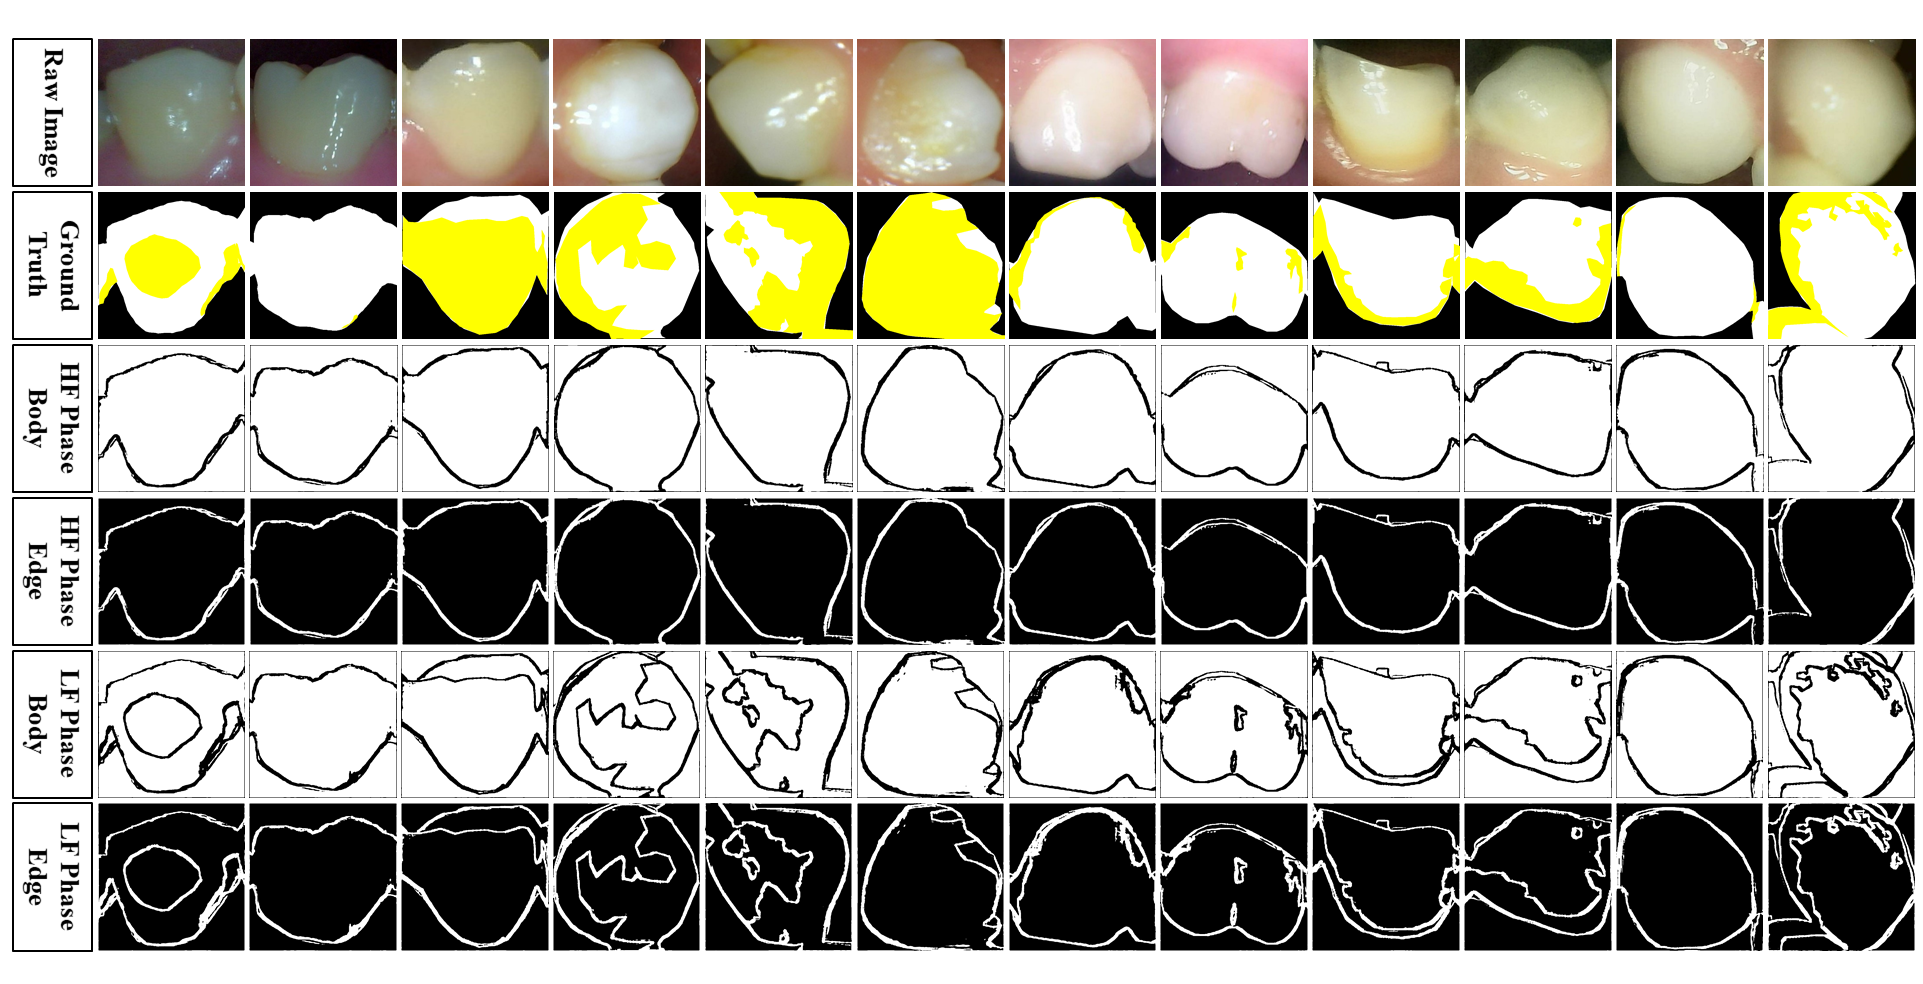
Fig.3. Visualization segmentation results in HF and LF phases for
the edge
and
body. The binary edge maps correspond with the boundary of
teeth and plaque
precisely. The binary body and edge maps are complementary to each other.
The
third and fourth rows of the visualization show the binary body map and the
binary edge map in the HF phase, while the fifth and sixth rows show the
binary
body map and the binary edge map in the LF phase.
Visualization results of the body and edge binary map. The
visualization of
the body and edge binary map generated by the HF and LF phases are shown in
Fig.3. In the HF phase, our methods focus on segmenting the teeth and
non-teeth regions, resulting in a binary edge map that accurately identifies the edges
of
teeth. Our approaches can precisely locate the edge of teeth when some of the boundaries
between teeth and gingiva are blurry. In the LF phase, we segment the plaque and
non-plaque
regions, leading to a binary edge map highlighting the edges of both plaque and teeth.
The
binary body map is complementary to the corresponding edge binary map, providing
additional
information on the location of plaque and teeth within the image.